Welcome to MyRobin’s 2023 Recap! This page is dedicated to showcasing the significant impact we’ve made this year in connecting businesses with pre-screened, on-demand, and flexible blue-collar workers.
A look at MyRobin’s success in connecting businesses with on-demand workers through its growing Mitra network.
MyRobin is thrilled to announce a 28,31 % increase in Mitra distribution across cities and regions from 2022 to 2023! This means [number] more businesses in diverse locations can now access our on-demand workforce solutions and experience the benefits of a flexible staffing model.


MyRobin is proud to announce a significant year of innovation, introducing cutting-edge features and technologies that redefine the on-demand workforce experience. Our dedication to constant improvement has resulted in advancements that benefit both businesses and workers, streamlining workflows, enhancing matching accuracy, and empowering everyone to achieve their goals.
Successfully connecting X number of workers with fulfilling opportunities.


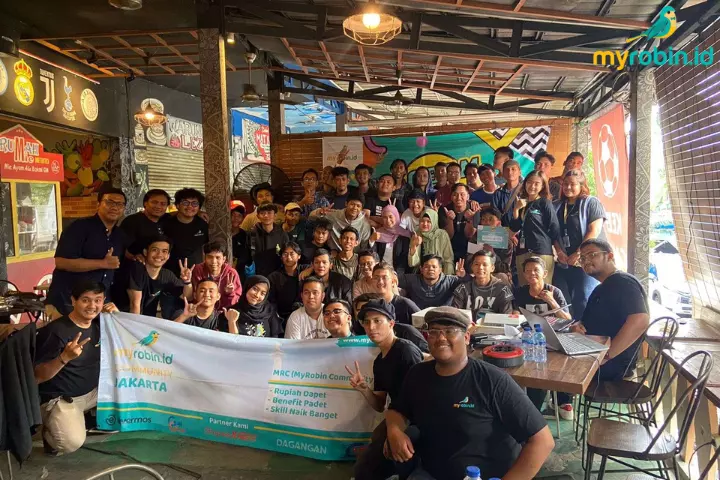
Our community initiatives:
Successfully connecting X number of workers with fulfilling opportunities.


Total Active Mitras
Total Mitras during 2023
Community Members
User on App
In 2023, MyRobin’s ecosystem blossomed into a thriving hub of connection, opportunity, and growth. Here’s a glimpse into the remarkable numbers that define our collective impact:
A Dedicated Workforce:
A Flourishing Community:
These figures paint a compelling portrait of MyRobin’s expanding reach and the collective dedication of our members. Together, we’re transforming the way businesses access talent and empowering individuals to take charge of their career paths. As we look ahead, we’re committed to nurturing this dynamic ecosystem and unlocking even greater potential for all.
2022 has revealed our continuous and rapid User Growth each month
Lorem ipsum dolor sit amet, consectetur adipiscing elit. Pellentesque lorem neque, interdum ut efficitur in, maximus vel leo. In quam diam, dignissim id felis ac, varius consequat tellus. Ut quis turpis vel lacus molestie auctor ut at lorem. Integer mattis lobortis erat eu rutrum. Sed finibus velit quam, vitae laoreet sem porttitor aliquam. In vehicula nunc massa, vitae gravida ipsum molestie sed. Vestibulum sit amet fermentum diam.
Cras et pellentesque diam. Nullam suscipit tortor metus, eu consequat lacus cursus ut. Phasellus rhoncus leo id consectetur aliquet. Suspendisse sit amet tellus blandit, lacinia quam quis, scelerisque est. Integer tempus imperdiet placerat. Quisque metus felis, tincidunt vel iaculis sed, rutrum vitae arcu. Proin laoreet neque arcu, in placerat velit fermentum rutrum. Fusce placerat nibh at blandit dignissim. Mauris eu tellus sem. Nam sed consectetur purus, quis interdum dui. Nunc venenatis odio vel dolor tincidunt, at vulputate leo tristique. Integer finibus, urna a fermentum porta, augue leo euismod elit, eu malesuada ligula massa eu justo.
Donec quis fermentum est. Morbi pharetra aliquet purus, a vehicula ipsum mollis vitae. Nulla feugiat consectetur ex, eget venenatis justo iaculis a. Ut vel fringilla leo. Aenean mattis rhoncus sem id auctor. Mauris non facilisis libero, id porta leo. Nullam eu aliquam enim. Nulla facilisi. Nam lobortis sodales posuere. Integer at ligula non erat rhoncus vestibulum nec rhoncus risus.
The dynamic trends shaping MyRobin’s landscape in 2023, showcasing both industry demand shifts and evolving client partnerships.
Demand by Industry: A Shifting Landscape
Our vertical chart paints a fascinating picture of how industry demand evolved in 2023 compared to 2022. While Retail & FMCG remains the dominant force, capturing 34% of demand (down slightly from 36% in 2022), other sectors are making their mark.
Client Partners: Expanding Reach and Diversification
Another exciting trend lies in the evolution of our client base. While companies with less than 200 employees continue to represent the largest group (51% in 2023), we see a significant surge in partnerships with larger firms:
These insights reveal a thriving MyRobin ecosystem, adapting to dynamic industry demands and fostering diverse partnerships across all company sizes. We are excited to continue connecting businesses with exceptional talent and empowering individuals to find fulfilling work opportunities in 2024 and beyond.
This vertical bar chart paints a picture of worker turnover at MyRobin throughout 2023, from January to November. Each bar represents the percentage of workers who left the platform or ceased engagement within that month.
Here’s what we see:
This is just the first chapter in the story: Further analysis is crucial to understand the “why” behind these fluctuations. By diving deeper, we can build targeted initiatives to attract and retain top talent, making MyRobin an even more fulfilling platform for everyone.


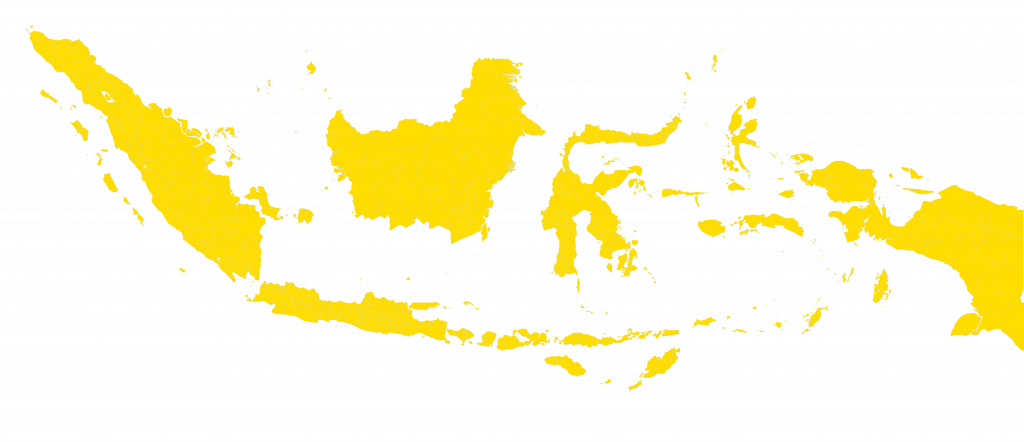
Our Partners are located in 350+ Cities across Indonesia in 2023
Geographic Reach:
Gender & Age Breakdown:
Unveiling Hidden Potential:
Education
This data paints a dynamic picture of MyRobin’s workforce. We’re proud of our geographic reach, growing female representation, and commitment to inclusivity. We’ll continue to nurture a diverse and vibrant community, empowering individuals and businesses to thrive across Indonesia.
Lorem ipsum dolor sit amet, consectetur adipiscing elit. Pellentesque lorem neque, interdum ut efficitur in, maximus vel leo.
252+ of Mitra guaranteed with BPJSTK and private healthcare Insurance
200+ accident cases being fully covered and handled properly
200K+ People getting access to fair employment with MyRobin
Almost IDR 300 Billion total wages distributed
600+ of Mitra enjoyed the benefits from Early Wage Access & MyWarung
40+ capacity building programs held to upskill our mitra